Polity: Meet the middle
254 Responses
First ←Older Page 1 … 5 6 7 8 9 … 11 Newer→ Last
-
BenWilson, in reply to
I think subtweeting is very much about intention rather than the practicalities.
Yup. I was actually jesting anyway. I didn’t expect you-know-who to take offense. I didn’t know subtweeting could be done outside twitter.
-
To me subtweeters just seems to fill a gap in the spectrum between subwoofers , woofers and tweeters … so, not following this at all.
Is it something used for a dogwhistle? -
chris, in reply to
And my fortune, rounded to nearest billion, is the same as John Key’s.
ahem, but harking back:
I’m not optimistic, but I’m at least trying. It’s an extremely complex question. Perhaps precision is impossible. If so, I think that a data driven discussion is also impossible, and the whole thing comes down to shouting. So I’m just working on the assumption that this is not the case, because it’s the only hopeful position, since I’m not optimistic about my chances of shouting down the Internet.
I think data driven discussion is eminently possible, but with that much data, spanning 9 election cycles, addressing all manner of topics, why has Rob begun the discussion in the centre looking outwards instead of beginning on the perimeter and analysing policy and other preferences with the clear intent of working towards majority? Why begin this type of conversation based on these left/centre/right questions – in which an average of well over 25% fall into the missing/don’t know category, when there’s so much more tangible data to discuss? Why even lead with a hypothesis in this type of exercise?
-
In the same kind of way as – why lead with a policy that is this borderline? From the data it’s clear that there are many traditional Labour policies that garner much stronger support such as healthcare spending, energy company regulation, education spending. It's like flaunting all the accouterments of a centrist without ever looking at the job description.
-
Rich Lock, in reply to
To me subtweeters just seems to fill a gap in the spectrum between subwoofers , woofers and tweeters … so, not following this at all.
Is it something used for a dogwhistle?You tend to get a lot of screeching, howling feedback, and the signal-to-noise ratio is appalling.
Does that help?
-
BenWilson, in reply to
why has Rob begun the discussion in the centre looking outwards instead of beginning on the perimeter and analysing policy and other preferences with the clear intent of working towards majority?
I don't know. Probably best to address that question to him. I'd say he feels there's strong evidence that centrist strategy works, in direct contrast to many claims that it's wrong on first principles. I already gave my take on the earlier thread about the worth of the strategy.
-
chris, in reply to
I guess what I was trying to gauge is whether some statistical imperative is being employed as far as you are aware? Which is probably a foolish question, excuse my ignorance.
What I really want to know is how far right or left of center Labour’s policies are and whether compiling the preferences from one of the questionnaires might be helpful in clarifying Labour’s policy position in relation to this policy center and in determining whether a shift towards center would entail moving left or right, if at all.
The overriding assumption throughout this discussion from all sides, including the post you just linked me to seems to be that a centering of Labour must entail it moving right. I can’t see much in the way of solid data being presented here to affirm that other than Labour traditionally equals left, people assume that to be the case, and they lost some elections.
-
BenWilson, in reply to
I guess what I was trying to gauge is whether some statistical imperative is being employed as far as you are aware?
I'm not sure what you mean. Can you elaborate?
What I really want to know is how far right or left of center Labour’s policies are
Yes, I'm interested in the same question, although I can see that the first problem is even defining the terms.
and whether compiling the preferences from one of the questionnaires might be helpful in clarifying Labour’s policy position in relation to this policy center and in determining whether a shift towards center would entail moving left or right, if at all.
I think that's not unhelpful, but personally I'm working with the data set itself from the same site. Those summaries are good if you just want to get an idea about how the whole group felt on each question. But with the data you get how each respondent answered each question, so you can look at the correlation between questions, clustering into groups, etc. You have to be able to load in the data and manipulate it, though. It's an SPSS file, that I loaded into R.
The overriding assumption throughout this discussion from all sides, including the post you just linked me to seems to be that a centering of Labour must entail it moving right
I think the only way that could be false would be if Labour was on or to the right of the center. So the question about whether that is true is interesting, and to answer it numerically requires a sound definition of left vs right. Getting that definition doesn't solve whether they should actually move, it just helps us understand where they are and what that move would actually be. The moral/practical question about whether they should move is another matter.
I can’t see much in the way of solid data being presented here to affirm that other than Labour traditionally equals left, people assume that to be the case, and they lost some elections.
I think the data pretty clearly shows that most people think Labour is on the left and National is on the right. Brent asked a very tricky question about the extent to which the same people actually think that or whether something else is at play. The data is there to answer the question and I will certainly try.
-
BenWilson, in reply to
Perhaps a graph of where National was placed for those who ranked Labour at 10, and a graph of where Labour was placed for those who ranked National at 0, would be enlightening.
Similar graphs for where they placed themselves (including did not or invalid ?).
I’ll have a go tomorrow. Just completing a proposal to mine this data for an assignment, after which I’ll have every reason to play hard with it.
ETA: Hmmm. By tomorrow I actually mean today....
-
chris, in reply to
Can you elaborate?
In no way shape or form.
I think the only way that could be false would be if Labour was on or to the right of the center.
I’ve just been rereading through the 2015 budget thread, some good musings there. 2011 sure seems a very long time ago now. Anyway thanks for your patient responses Ben, they are very much appreciated as always.
with the data you get how each respondent answered each question, so you can look at the correlation between questions, clustering into groups, etc.
I look forward to seeing what you come up with. As far as data driven discussions go, not much has been provided for the average reader thus far.
-
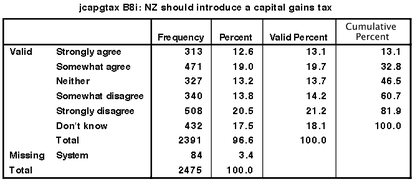
BenWilson, in reply to

Actually I had a thought how to answer your question, Brent. I had to jitter the points, otherwise the graphs all just looked like a grid because the variables are categorical.
Let me know if you don't understand how to interpret this graph...it's kind of overkill on your question :-)
-
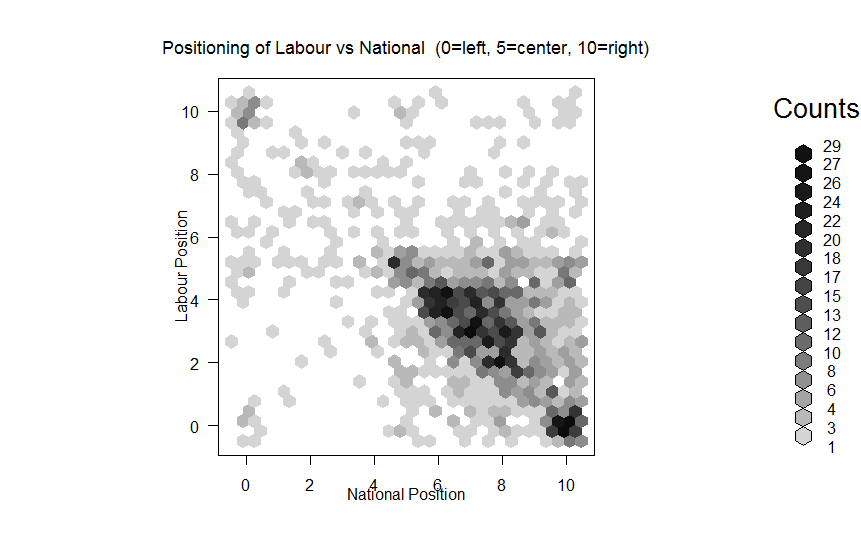
And same plot but only with National and Labour, for a blow up. The Nat vs Lab is the hardest to interpret. If it really says what it looks like it says, then that's highly counter-intuitive.
-
On second thoughts, it makes sense. I was puzzling about the apparent negative correlation in the big crowd to the lower right of the Nat vs Lab scatter. But I guess that does make sense – that's the trendline of people who think there’s a real difference, through to those who think there’s no difference (reading right to left).
You’ll note that there’s a cluster in the top left who think Labour’s extreme right and National is extreme left. Did that answer your question?
-

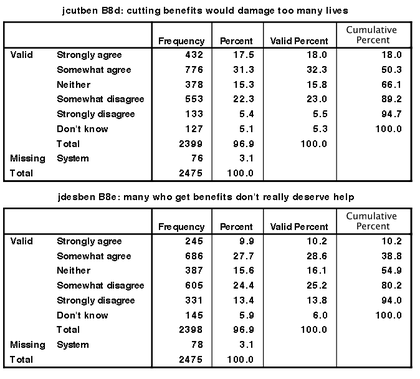
In case it didn’t (the scatters have a lot of data points so blobs lose structure), here’s binned versions. The pretty one is jittered, so it’s shape looks a bit more random than it actually is. The one using relative sizes is centered so you can read off the actual count ranges for the particular values.
ETA: I think the centroid one shows a little more clearly how insignificant that upper left corner cluster really is. It only stand out in the scatterplot because its isolated.
-
Steve Barnes, in reply to
Is it something used for a dogwhistle?
Its kind of the opposite, its what twats do to ignore the real issues, a bit like LA LA LA l CAN'T HEAR YOU LA LA LA .........
-

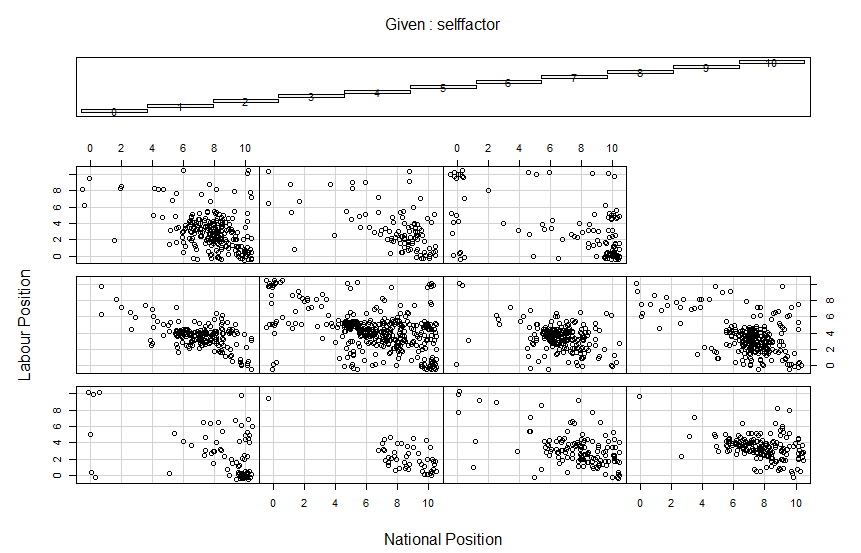
Last one for Brent…conditioning plot. One plot for each level of self rating. The order of these is annoying and hard to label. Counting the self positioning from 0 to ten, you find the correct plot by reading from the bottom left to the top right.
So bottom left is for self-position=0. Bottom right is self-position=4. Left middle is self-position=5. Top right-most plot is for self-position=10.
I love these plots, only just learned about them. So cool to be able to see three dimensional structure in 2 dimensions.
I don’t see any particular conditioning effect – it seems that the same kinds of proportions of the answer combinations occur no matter where the respondant positioned themselves.
ETA: This is on jittered points. Impossible to see anything interesting otherwise. Each plot is how the respondent rated Labour's position against how they rated National's.
-
The only thing that seems interesting to me in the conditioning plot is that the little clusters in the top left of each graph representing the people saying Labour is extreme right and National is extreme left. It’s biggest in people rating themselves in the exact center (but probably because this is the biggest group in total), following by the people rating themselve extreme right, followed by people rating themselves extreme left.
But all of these clusters are small. No matter how they positioned themselves, most people rate Labour as to the left of National.
ETA: Also interesting, just noticed. People who rate themselves as 1, so very left but not extremely, have the least variation by far. Only 1 single person took the weird point on the top left, all the rest are around the average position in the bottom right.
-
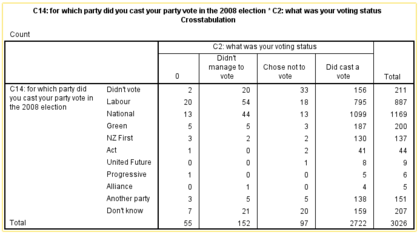
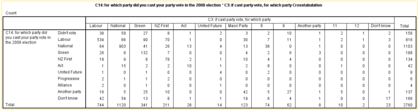
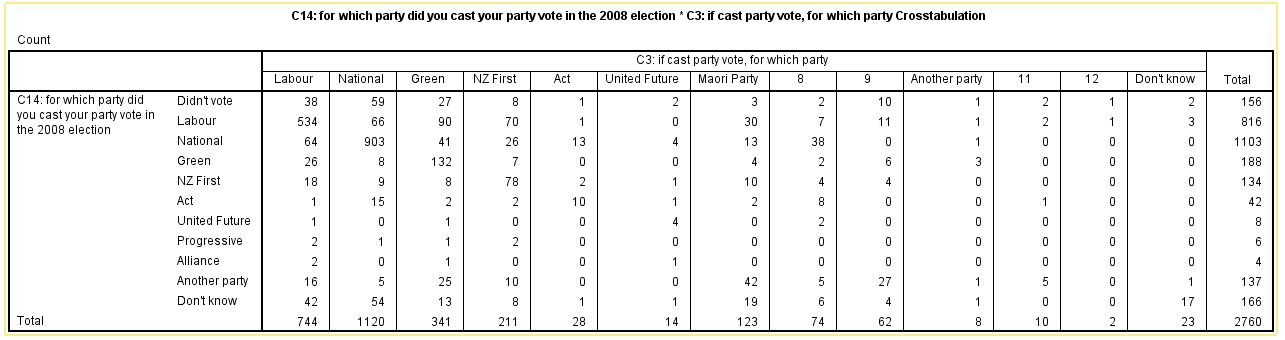
Now that I’m near a computer, what people did in 08 and if the voted in 11, and what they did in 08 vs who they voted for in 11
-
Actually, I revise my opinion on the lack of conditioning. It does look like the closer to the center value a person self rated, the less distinction they see between Labour and National. The center of the clouds seems to start in the bottom right for self=left, moves toward the middle for self=center, and then it moves back to the bottom right for self=right.
ETA: Fixed erroneous left/right confusion in above.
-
Just a technical note for the benefit of people playing with the NZES, as a SPSS save file I can read it into R with the haven package, but because there are missing entries in the values labels, I am being really cautious about using those labels. This code might be useful to others:
library(haven)
ds <- read_spss(file.choose())
intery <- dataset[,c(234,235,269)]applyValLabels <- function(column){
knownvalues <- attributes(column)$value.labels
valuelabels <- names(knownvalues)
lookup <- data.frame(column = as.character(knownvalues), valuelabels, stringsAsFactors = FALSE)
target <- data.frame(column = as.character(column), index=1:length(column), stringsAsFactors = FALSE)
combined <- merge(target, lookup, all.x=TRUE)
combined <- combined[order(combined$index),]
output <- as.character(column)
output[!(is.na(combined$valuelabels))] <- combined$valuelabels[!(is.na(combined$valuelabels))]
return(output)
}
jpartyvote <- applyValLabels(intery$jpartyvote)
table(jpartyvote, intery$jpartyvote) -
Brent Jackson, in reply to
Thanks for that Ben. Interesting, but, like you, I having trouble drawing any conclusions about it. Of the people who ranked Labour as 10 and National as 0, the most is (as you say) self-ranked as 5 (the largest group). However, the other significant cluster is with people who ranked themselves as 10. So they are presumably Labour supporters, and got the axes wrong (ie left and right held no meaning for them).
Can we categorise people in some other way ? For example :
Leftists : ranked 3 or more lower than Labour & Labour lower or equal to National
Labourites : ranked within 2 of Labour but not within 2 of National
Swing : ranked within 2 of Labour and within 2 of National
Nationalites : ranked within 2 of National but not within 2 of Labour
Rightists : ranked 3 or more higher than National & Labour lower or equal to National
The rest are confused (or uncategorisable at least) ?Damn hard to get anything useful from it.
-
Wicked, thanks for that David. I didn't spot any labels that got mixed up, but good heads up. I'll keep an eye out for it. So far the variable names seem to be mnemonics for the labels I've got.
-
BenWilson, in reply to
So they are presumably Labour supporters, and got the axes wrong (ie left and right held no meaning for them).
That was one hypothesis I mulled. I decided I'd leave it unmediated by my perceptions, and see if you got the same idea.
-
BenWilson, in reply to
Can we categorise people in some other way ? For example :
There's a very large number* of possibilities. Rob Salmond mentioned upthread what his method was. It's not crazy, but it does use National and Labour as the reference point and is thus, as Sacha comments, FPP flavoured. He mentions his method for centrists, and I presume left and right are the leftovers in each direction, although he doesn't actually say so.
We've also got the respondent's own self rating of which party they are closest to. I think that might be useful for finding "Labourites" and "Nationalites", possibly more useful than what you suggest. This self rating is in two separate questions, just for more multi-dimensional confusion :-). One is "which are you close to". The other is "which are you closest to". I wonder how much trouble respondants who were not highly competent in English might have had seeing the difference here.
-
BenWilson, in reply to
The rest are confused (or uncategorisable at least) ?
Or maybe it's we who are confused? In this question, the entire thread hangs. Do we listen to them and find what they mean by left and right? Or decide what left and right means for them, and divide them into the confused and not confused, then left and right? Possibly throwing away half of our population in the process.
Other possibilities: Data capture/entry error. Deliberately confused answers put in to frustrate the statistical process on purpose. Genuine belief that Labour is right because they're "feminazis" and National are left because they're "neoLIBERALs".
I think we can only really progress by trying it as many ways as possible and seeing how it fits. I've also got another idea, but I'd like to surprise people with it, and it will take some time to get it out. Gut feeling is that good stats will mean that the small size of those "confused corner" clusters would mean they don't really affect the models.


Post your response…
This topic is closed.