People who follow me on Twitter, and people who read me here, may recognise that I like facts, and accuracy.
I will see a claim in a tweet, and wonder if it is true, or I will see a question in a tweet, and wonder what the answer is. I will want to know, and figure that the type of person who still follows me after all my tweets may at least be somewhat interested in knowing too. Sometimes I have the good sense to work out they won’t (I recall once realising that the world didn’t really need me to correct a humorous aside about which number book in the Baby Sitters Club series a particular title was) but that often doesn’t win out. Mostly, it’s just Google, or Wikipedia. Occasionally I go to ridiculous lengths to accurately answer a query, or sate an interest.
OIA requests are not uncommon. The Ministry of Health recently provided such excellent service on a data-seeking OIA that I felt compelled to respond “A++ would OIA again” (After the Minister of Social Development told Parliament that she and MSD didn’t know how many beneficiaries had committed suicide, the Ministry of Health in just over two business-hours that, from 1998 to 2014, there were 576, not including superannuitants).
There have been at several at-least-partially successful complaints to the Ombudsman (the Aviation Security’s investigation into Gerry Brownlee, and the DIA over ministerial cars, after Simon Bridges told the NZ Herald he’d bought a couple of electric cars (in fact, one was bought by taxpayers)). There have been Court records requests, including one that required a formal application in Court (I may blog that at some point: it turns out that the IRD does a lot before they’ll seek an arrest warrant in a student loan case, but perhaps not enough to claim arrests are a “last resort”).
And sometimes there’s maths, especially around elections. I’m no Keith or Harkanwal, but in my small sphere, I try to add to the sum of knowledge, even if in very small ways.
Most of the time, my analysis goes into the ether. I can come back to it if it becomes relevant again, but it mostly just exists at a time and then is gone.
But because there’s an election on, and each of these has come up a couple of times recently, I figure there might be a wider audience for a few bits of simple maths I did recently.
How many votes are needed for two seats, or three?
First: a table showing the vote total and vote share at each MMP election that would have been necessary for a party below 5%, but winning an electorate seat, to get different seat totals (vote totals assume all parties that won seats kept their vote totals, percentages assume same overall number of valid party votes):
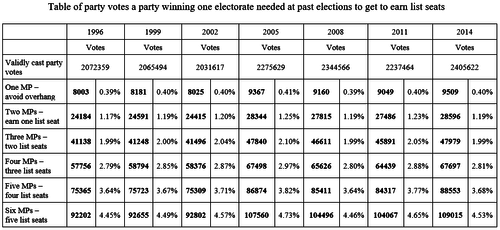
As you can see, the “rounding” tends to be quite generous, but the range of votes needed can vary quite a bit depending on the size of the “wasted vote” (ie votes for parties that don’t cross the 5% threshold and don’t win an electorate).
Where are New Zealand’s bellwether electorates?
Second, with some recent discussion of bellwether electorates, I made a ranked list of New Zealand electorates by how close the party vote cast in that electorate was to the party vote over the whole country.
Despite some suggestions it might be Ōhāriu, I determined the electorate most closely aligned with the overall mood was Ōtaki. You can see how close it was by looking at the party vote each party got compared to nationwide vote (eg the Greens got 10.70% nationally vs 9.46% in Ōtaki; Labour 25.13% vs 24.84; National 47.04% vs 49.08%; and New Zealand First 8.66% vs 9.96%). It’s not a perfect match, but a lot close than many others.
After having my interest piqued by the question, I calculated an index of disproportionality for each electorate, which shows how much it differed from the country as whole (an electorate with 0% would be an electorate that perfectly matched the nationwide party voter share for each party locally):
1. Ōtaki (2.15%)
2. Hamilton West (2.58%)
3. Hamilton East (2.71%)
4. Hutt South (3.01%)
5. Napier (3.01%)
6. East Coast (3.24%)
7. West Coast-Tasman (3.30%)
8. Invercargill (3.47%)
9. Nelson (3.48%)
10. Whanganui (3.57%)
11. Northcote (3.69%)
12. Wigram (4.21%)
13. Christchurch Central (4.30%)
14. Tukituki (4.67%)
15. Port Hills (4.94%)
16. Ōhāriu (5.02%)
17. Palmerston North (5.03%)
18. Papakura (5.22%)
19. Wairarapa (5.78%)
20. Rotorua (5.90%)
21. Upper Harbour (6.21%)
22. Whangarei (6.67%)
23. Rangitata (6.85%)
24. Northland (7.05%)
25. Rimutaka (7.07%)
26. New Plymouth (7.16%)
27. Christchurch East (7.36%)
28. Rangitīkei (7.38%)
29. Dunedin South (7.84%)
30. Mana (8.33%)
31. Maungakiekie (8.37%)
32. Te Atatū (8.41%)
33. Mt Roskill (8.65%)
34. Waimakariri (8.77%)
35. Waitaki (8.88%)
36. Coromandel (8.89%)
37. Kaikōura (9.03%)
38. Auckland Central (9.12%)
39. Taupō (9.21%)
40. New Lynn (9.64%)
41. Ilam (9.72%)
42. Botany (10.56%)
43. Mt Albert (10.74%)
44. Tauranga (11.03%)
45. Pakuranga (12.12%)
46. Helensville (12.29%)
47. Bay of Plenty (12.30%)
48. Waikato (12.53%)
49. North Shore (13.13%)
50. Taranaki-King Country (13.49%)
51. Rodney (13.75%)
52. Clutha-Southland (14.03%)
53. Dunedin North (14.48%)
54. Selwyn (14.61%)
55. Epsom (14.99%)
56. Hunua (15.12%)
57. East Coast Bays (15.15%)
58. Wellington Central (15.47%)
59. Tāmaki (15.47%)
60. Rongotai (15.77%)
61. Kelston (15.93%)
62. Manurewa (24.50%)
63. Te Tai Tonga (26.22%)
64. Te Tai Tokerau (31.72%)
65. Tāmaki Makaurau (32.12%)
66. Te Tai Hauāuru (33.21%)
67. Hauraki-Waikato (33.22%)
68. Manukau East (33.60%)
69. Ikaroa-Rāwhiti (35.15%)
70. Waiariki (35.45%)
71. Māngere (37.64%)
Did Stars Hollow Vote for Trump?
Finally, something even a little older, and lot more frivolous: After Gilmore Girls: A Year in the Life was released on Netflix, Creator Amy Sherman-Palladino and her husband and co-executive producer Daniel Palladino were doing the interview rounds and in an interview with Vulture were asked how fictional town Stars Hollow would have voted in the then-recent US Presidential election. They couldn’t agree. Despite the protestations of several (well, two) of the TV critics I follow on twitter that the question was somewhat ridiculous as “the idea that Stars Hollow is “rural America” shows you the exact standard of realism to measure the show by”, I spent half an hour or so cross-referencing voting data in Connecticut with Wikipedia’s list of Connecticut Towns governed by Town Meetings (they’re a real thing, with actual legislative power in several US states) to try to figure it out.
In the end, it was probably too close to call for a particular town, but Trump won 60% of Connecticut polling places in towns governed by Town Meetings, and such towns overall 227897 votes to 223375, so there’s a definite chance. It even earned me this tweet from New York Times critic James Poniewozik:
I salute your nerdery, sir
— James Poniewozik (@poniewozik) December 1, 2016
Who could ask for more than that from a Twitter feed?
ps if you haven’t already read Emma’s two Q&As on how voting works (part 1; part 2), I recommend them.