Posts by JonathanM
Last ←Newer Page 1 2 3 4 5 Older→ First
-
Hard News: Privacy and the Public Interest, in reply to
A weird order - with the exception of the top 4, it appears alphabetical? Maybe I'm seeing patterns in random?
-
Given your requirements (4 adults, most of whom enjoy long showers) then be careful as capacity is likely your largest constraint. In the summer you'll probably be OK as the sun will reheat things fast enough to not be a problem, but in winter unless you also supplement with electricity, wet-back, or possibly both, you'll likely learn to shower a lot quicker or face the no-hot-water left problem.
Efficient shower heads may reduce this somewhat, but at 10l/min (decent, but not overly high flow) will mean about 4-6l/min hot water from the tank, so between 50 and 75 minutes from a 300l tank. For 4 people who enjoy long showers, that could get a bit tight, though a 10minute shower is longer than you think...
PV or heat pump HW doesn't have that problem, nor does instant gas. The latter works well - use the HW cupboard for something else - but may not be as green!
All the systems add complexity, so make sure you take into account maintenance costs (I'd allow double from whatever is quoted).
-
Personally I prefer a land tax. After all, in most of the places with housing shortage, the majority of the cost is in the land, not the house upon it. Further, by occupying land, a business, homeowner, farmer etc. is depriving others of revenue from and enjoyment of that land. The current CGT as put up by Labour (and the Greens for that matter) excludes the majority of the residential real-estate market, so will not make enough of a difference to justify the inefficiencies in collection.
Keep it simple with a broad (no exclusions) land tax, of which a portion goes to local government via rates, and a portion to central government, reflecting the various costs for infrastructure required etc.
-
Great work David! Being about three-quarters of the way through renovating our place, my wife and I fully appreciate the 'everything is about 95% done'. The bathroom floor needs relaying. The toilet is just sitting there (waiting on the floor to be redone). No mirror in the bathroom. Various hooks for hanging things tacked temporarily in place. The joy of an old house mid-renovation. :)
Your work looks superb. I am extremely envious of that saw and buzzer!
-
Hard News: Gower Speaks, in reply to
I might have missed discussion of this, but are there any references you (or others) can point me to which discuss these house effects in more detail? I’m getting curious.
For example, are they consistent for a given research house over some years? How consistent? Could some sort of model incorporating randomness account for them?
Peter has a bit of info on the model underneath the code.
https://gist.github.com/pitakakariki/2791866
The model is per-party GAMs with a smooth function of date, and additive fixed effects for polling house. Thus, same shape, different constant levels per polling company. The election is included as a separate polling company and weighted 1000-fold higher than the polls. This is basically equivalent to fitting separate parallel curves through each polling companies results, then moving the curves up or down to pass through the election result.
I'm not sure what you could do about house effects changing through time. We know they likely will (due to methodological changes) but estimating that might be tricky. An idea off the top of my head would be to assume methodological changes would be some sort of step function that occurs at a sufficiently slow rate? A start might be to just split the data post election into two time periods, and estimate separate house effects for the two periods. The first time period's house effects are found based on the election result, and the second such that the corrected mean 'truth' needs to be continuous?
-
5. The correlation is partly due to the fact that the party vote is necessarily dependent (they add to 100%).
Turns out that when you take this into account, the movement of Labour/National is unsurprising, but some of the others are (e.g. Green/National is higher than you'd expect). If the polls were just random variation around the true unchanging value, you'd expect negative correlation between all pairs of parties, with the magnitude increasing with the proportion of the vote that the parties command. That you get positive correlation or no correlation between some pairs suggests that there is some net movement over and above the sampling noise.
6. All of the above + other stuff?
-
Hard News: Gower Speaks, in reply to
The average house-effect for the Greens from Peter Green's poll of polls is 0.46%, so not as high as other parties, but around 1/2 of a seat. Roy Morgan is at 1.2% and Fairfax Media Ipsos at -0.2%.
-
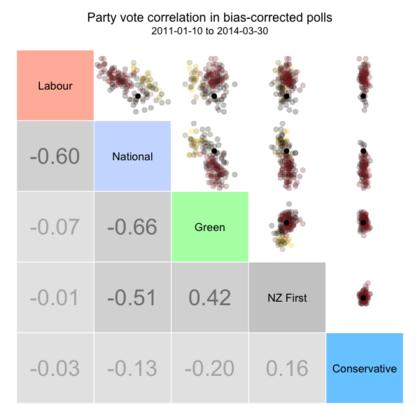
One thing I noticed - the scale on the scatter plots are not the same. The large movements across in the Conservatives column are actually pretty meaningless, as they're only fractions of a percent.
The updated one has constant scales (same patterns, just a bit easier to see the impact). Also, I've coloured the dots by when the poll occurred. Around election time they're transparent black, before then is yellow, and towards today is red.
-
Unfortunately the data source that Peter uses (wikipedia) doesn't contain that information. It would be interesting to form a fuller picture of what is going on in the polls, and would be useful information to add in to the scenario generation.
I suspect that various folk that collect polls (e.g. David Farrar?) may already have the data - it'd be worth asking at least to see if anyone has it in a reasonably accessible form that could be added to the wikipedia page.
Otherwise, it might be possible to get by clicking through from wikipedia to the respective polling firms websites and finding the poll reports, but it'd be a chunk of time. Perhaps that could be crowd-sourced.
-
Hard News: Gower Speaks, in reply to
A+ :)
