Posts by JonathanM
Last ←Newer Page 1 2 3 4 5 Older→ First
-
Hard News: Gower Speaks, in reply to
For the other linked graph here: http://imgur.com/6QlKxfm
What this is showing in the middle (the black smudgy bit) is the number of seats (scales are seats) that the left or right achieve in simulated elections. i.e. it shows that as the number of seats on the left increase, the seats on the right decrease as you would expect. The light blue and red areas are where the right + left would need to be to govern. The histograms are the marginal distributions of left and right respectively, with darker colour indicating they can govern. i.e. there’s around a 25% chance of the Right governing here, but no chance of the Left.
The graph precludes NZ First, but in all the simulated elections Winston was present with around 9-10 seats. If he chose to go with the Left, therefore, they’d have the numbers around 75% of the time or so. If he chose to go with the Right, they’re well home all the time.
The takeaway from this is that if the election were held today, and goes as predicted, the Left is reliant on Winston getting in and siding with them, where as the Right has a chance of governing (Nats/Maori/Act/UF) without him.
-

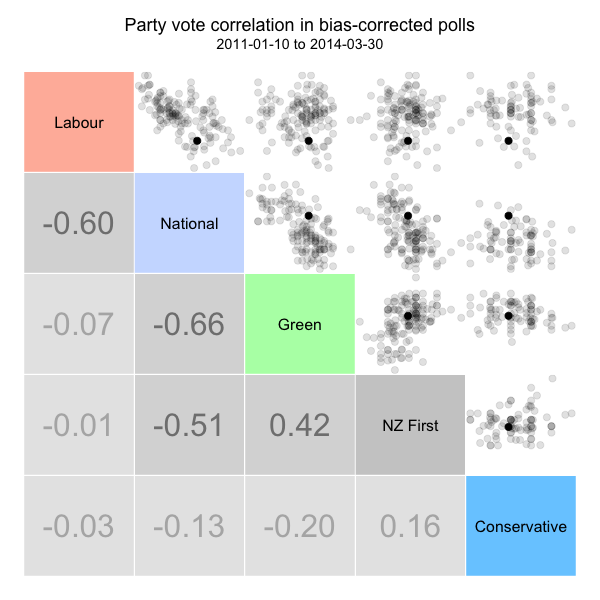
For the scatter plot, I’ve done with with the bias-corrected polls, just to make sure that the results aren’t coming from some polling firms consistently under estimating one party while over estimating the other (that’d produce a trend in the plots that doesn’t really exist, assuming the bias estimation is getting things right ofcourse!)
This one looks a bit prettier. I’ve popped the actual correlation in the bottom right panels, with the scatter plots in the top right. If correlation is positive for a pair, then both parties go up at the same time (likely due to some other party going down, contributing votes to both) whereas if the correlation is negative for a pair as one goes up the other goes down. The darker coloured correlations are statistically significant, light ones are not. The dark dot is the election result. All other dots are bias-corrected poll results. Results are in agreement whether the raw data or corrected data are used, with the exception of the Conservatives, where there’s a suggestion of a negative correlation with National (correlation -0.26).
Ideally this would be turned into a nifty SVG where highlighting each point showed you wish poll, and made all results from that company bigger etc.
-
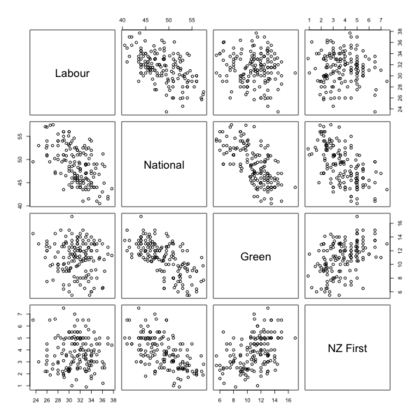
Do the Greens steal votes from Labour? Does NZ First steal votes from National?
If we look back at the polls (rather than use the output from the simulator from poll of polls, as we know they’re independent with the exception of National due to the way it predicts) then we can assess the dependence between the parties.
Also, prompted by David’s comment on github about how we might show the lack of independence between the number of seats of left and right, I had a little play, the result of which is here:
-
@BenWilson: According to the output from Peter Green's poll of polls, P(W) = 1. Nats + Winston are then around 10 seats clear.
In the scenario analysis that I've done from the poll of polls, it indicates that the Nats have a 23% chance of going it alone* without Winston (even when he gets in), whereas Labour's only shot is with Winston, and even then they only make it over the line 66% of the time.
*alone here means Nats + Act + UF + Maori.
I'm not sure if there has been much entertaining as to whether Maori will go one way or the other. If they switched to going with the left then the numbers above reduce to 1% chance of Right alone and 98% chance of Left+Winston. Still no possibility of Left alone though!
-
There was (and is still until the PR is in) a bug in my code, which meant that parties under the threshold without an electorate weren't ignored. As this most likely means the Conservatives get counted when they shouldn't, the result is quite important.
With Colmar Brunton the fixed result is 47% Nats, 53% Winston and a small chance (about 0.05%) of either labour-led or hung.
Fixed code available here:
https://github.com/jmarshallnz/OneVoteTwoVoteRedVoteBlueVote/tree/ignore_parties_under_threshold
I suspect things will be quite different with the house-effect adjusted poll of polls - I'll see if I can get a routine written up that samples a bit better from that.
-
Hard News: Gower Speaks, in reply to
It's probably actually a little tricky to combine the two models due to the lack of independence between the larger parties at least? You can probably get reasonable estimates by sampling party support from small to large using rnorm with appropriate mean + sd as per Peter's estimates + CIs (i.e. replace the rdirichlet), with the largest party's (Nats) proportion set to one minus the sum of the others.
That way you drop the largest problems with dependence (Nats+Lab) and also assure they add to 1. (You don't get rid of the likely dependence between Greens + Labour though, but it's probably not much of an issue).
-
David: Sure, MIT license is fine - more than happy with folk to use it and improve it. :)
-
Hard News: Gower Speaks, in reply to
Finding some mean/CI and framing some godawful backwards hypothesis test...
I think as long as you emphasise and discuss the mean (or effect size) and the CI rather than the P-value you're doing fine, but agreed in many contexts the Bayes approach tends to be more natural.
It'd be great if the Bayes technique was taught more to undergraduates, but that may be challenging given the mathematical sophistication required - I'm not sure how much you could get away with skipping that like you can with frequentist stats.
-
David: Nice! A good start, but I don't think we want to simulate a random number of seats in parliament given the proportion of the vote :). Rather, we want to simulate a random election, given the uncertainty from the poll results.
I've taken the liberty of updating it to operate within a Bayesian framework:
Based on Colmar Brunton alone, there's a 73% chance of National victory, with 27% chance of Winston deciding. With a bunch of assumptions ofcourse, such as electorates for Act, Maori + UF and no electorate for conservatives.
The nice thing about doing it in a Bayesian context is you can incorporate any uncertainty distribution you want (e.g. you could use realisations from Peter Green's bias-corrected poll of polls).
-
Sacha: That's better, yup, but you need to calculate exact binomial CI's for anything under about 1% or so (the binomial is too skew below that for the normal approximation to kick in). This will also mean you can estimate the CI for the 0's as well.
You can do this pretty easily in R using binom.test, but first need to the number of people rather than a percentage. We can't get this as we don't know the weightings used, but a simple approximation for our purpose is to just use the rounded number's once multiplied up by the 767 respondents.
In case you're interested, here's the code + table: