Hard News: Gower Speaks
206 Responses
First ←Older Page 1 … 5 6 7 8 9 Newer→ Last
-
One of the tricky things with the dependence vs independence is the reserve population of not voting, and the movements between the voting and non-voting.
Peter, I accidentally left my font on the free internet available "lovedbytheking" font so when I started making the diagram in Inkscape it was the first font it began using.
for those that know their R well enough to be comfortable with ggplot, there is a xkcd package for making you graphs look like hand drawn xkcd ones. the font installation instructions are a little out of date though.
-
Peter Green, in reply to
It's a really nice font, thanks.
-
Sacha, in reply to
Thanks, Steve. That was Excel. I admire R from afar. It was an honour to meet Ross Ihaka, though I'm not sure he believed me when I told him that. :)
-
Sacha, in reply to
Wow. Can you explain those a bit please.
-
Sacha, in reply to
Like how to get my post text both above and below the attachment?
I believe the text always appears beneath the attachment. And that you can Edit your post and attach another couple of images in the same comment.
-
BenWilson, in reply to
Do the Greens steal votes from Labour? Does NZ First steal votes from National?
We're looking for pattern in those, right? To my eye, I see Labour/National negatively correlated. Labour/Green barely correlated. Labour/NZF hardly correlated. National/Green negatively correlated. National/NZF negatively correlated. And then the really strange one: Green/NZF positively correlated.
I translate negatively correlated as "stealing votes from each other". But I'm not sure how to translate positive correlation. They make each other get more??? I think it's probably because they both get strong rises going into the elections. Correlation!=causation there, although there is possibly a common cause.
Do you think you could put in the non-voter dependencies on those 4? Because a strong positive correlation anywhere is quite counterintuitive unless the votes come from the undecided pool. I'd be expecting to see NZF and Greens negatively correlated with non-voters.
-
BenWilson, in reply to
Wow. Can you explain those a bit please.
I can tell you what they are, but I'm only guessing how to use them. They're scatterplots, each plotting one party against one other party. The dots are individual polls and the x val is one of the parties, the y val is the other. The middle diagonal has no graphs because you'd be plotting the party's performance against itself, and get a dead straight diagonal line of slope 1. So they're used to conveniently label the graphs. If you want to know which parties one of the graphs uses, look along the row for the y-axis party, and the column for the x-axis.
There's two graphs for each pair. This is actually somewhat redundant, because they show exactly the same information, the axes are just reversed. So row 1 col 2 shows National on the x axis and Labour on the y axis, but row 2 col 1 shows National on the y and Labour on the x.
Scatterplots are good for seeing if there's some kind of relationship. Does one seem to go up when the other goes up? Or down? The first type is probably a possible correlation, the second a negative. How tightly it's clustered to that line indicates how extreme the correlation is. So a sharp line will get close to 1 (which is what you'd get on a Labour/Labour plot - because the variables are obviously perfectly correlated to themselves). A big fuzzy oblong will get closer to zero.
-
Sacha, in reply to
Thanks. What about the other linked graph?
-

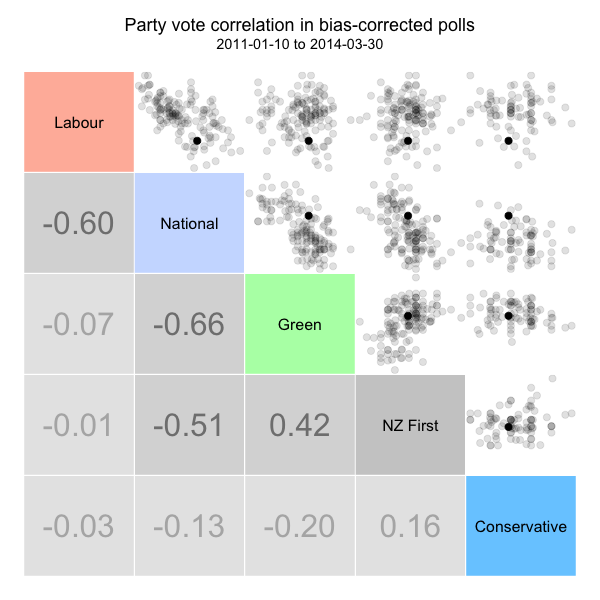
For the scatter plot, I’ve done with with the bias-corrected polls, just to make sure that the results aren’t coming from some polling firms consistently under estimating one party while over estimating the other (that’d produce a trend in the plots that doesn’t really exist, assuming the bias estimation is getting things right ofcourse!)
This one looks a bit prettier. I’ve popped the actual correlation in the bottom right panels, with the scatter plots in the top right. If correlation is positive for a pair, then both parties go up at the same time (likely due to some other party going down, contributing votes to both) whereas if the correlation is negative for a pair as one goes up the other goes down. The darker coloured correlations are statistically significant, light ones are not. The dark dot is the election result. All other dots are bias-corrected poll results. Results are in agreement whether the raw data or corrected data are used, with the exception of the Conservatives, where there’s a suggestion of a negative correlation with National (correlation -0.26).
Ideally this would be turned into a nifty SVG where highlighting each point showed you wish poll, and made all results from that company bigger etc.
-
BenWilson, in reply to
Not sure exactly. It looks like a scatterplot of Left vs Right totals, which are obviously going to be strongly negatively correlated. There is also a left and right probability density shown by the colored histograms.
Now I'm hitting total guesswork: I think the light blue band is an outright Right win, the light red one an outright Left, and the white area being one where it depends on the parties that aren't clearly either Left or Right (I'm guessing NZF, maybe Maori too?). The proportion of the dot cloud in each region would be the chance of a result in that region. So no chance of an outright Left. Looks like maybe 45% outright Right, and 55% where it depends what the uncommitted do.
The Right histogram is partially light, partially dark. The proportion of dark is the chance of an outright Right win. The Left one is only light, there is no chance of an outright Left win - it doesn't intersect with the light red region.
I think the corner is cut off the graph because that whole region is impossible - along that line the Left-Right totals are 120, representing the highest possible values which would exclude any non-Left/Right parties.
Cool graph. Would like to hear if I've guessed right.
-
BenWilson, in reply to
Hah, so my eyes were not fooling me! Greens and NZF are positively correlated!!
-
JonathanM, in reply to
For the other linked graph here: http://imgur.com/6QlKxfm
What this is showing in the middle (the black smudgy bit) is the number of seats (scales are seats) that the left or right achieve in simulated elections. i.e. it shows that as the number of seats on the left increase, the seats on the right decrease as you would expect. The light blue and red areas are where the right + left would need to be to govern. The histograms are the marginal distributions of left and right respectively, with darker colour indicating they can govern. i.e. there’s around a 25% chance of the Right governing here, but no chance of the Left.
The graph precludes NZ First, but in all the simulated elections Winston was present with around 9-10 seats. If he chose to go with the Left, therefore, they’d have the numbers around 75% of the time or so. If he chose to go with the Right, they’re well home all the time.
The takeaway from this is that if the election were held today, and goes as predicted, the Left is reliant on Winston getting in and siding with them, where as the Right has a chance of governing (Nats/Maori/Act/UF) without him.
-
JonathanM, in reply to
A+ :)
-
BenWilson, in reply to
And wow, thanks too. That's a great infographic. Any possibility of having the non-vote relationships there too? I'm really interested to see if there's any correlations between not-voting and the fortunes of any particular parties. My guess is that there would be a negative one for the Greens and NZF, and a positive one for National. But data beats guesses any day.
-
Unfortunately the data source that Peter uses (wikipedia) doesn't contain that information. It would be interesting to form a fuller picture of what is going on in the polls, and would be useful information to add in to the scenario generation.
I suspect that various folk that collect polls (e.g. David Farrar?) may already have the data - it'd be worth asking at least to see if anyone has it in a reasonably accessible form that could be added to the wikipedia page.
Otherwise, it might be possible to get by clicking through from wikipedia to the respective polling firms websites and finding the poll reports, but it'd be a chunk of time. Perhaps that could be crowd-sourced.
-
bmk,
Those are great graphics. Only thing is we don't really know what's going on in the background. Say in one poll. National loses 2%, Labour stays level and Greens gain 2%. The scatterplots would treat that as Greens taking votes off National right?
In reality what might be happening is Labour is taking 2% off National while Greens are taking 2% off Labour. Unless you had a panel you regularly poll and track the changes there would be no way of knowing.
-
"I suspect that various folk that collect polls (e.g. David Farrar?) may already have the data"
@dpfdpf Apr 2 "I have all the public poll data back to 1974. I should point out I didn't start collecting them in 1974 though, as I was just 7 :-)"
Some are having another whinge about polls at The Standard. Does anyone know if there's been any polling done on whether people want polls?
-
BenWilson, in reply to
In reality what might be happening is Labour is taking 2% off National while Greens are taking 2% off Labour.
Good point. Or there could be movements in and out of non-voting between choices. I can imagine that's not that uncommon. You stop being a tribal Labour voter, but have to take quite a lot longer to screw yourself up to saying you'd vote Green.
But we can't know if that's the case, or whether Greens are actually not that far from National that Labour is stepping stone. A direct movement is a simpler explanation. Also, we could be overthinking it all. The correlation might just be because the Greens polled very well going into the election, and National polled poorly. These event were synchronized, but it could be mostly coincidence. Greens campaigned strongly, and National was mired in teapots.
Labour's only clear correlation is with National. Whether this is direct, or via people flowing in and out of a non-voter pool, we can't tell. But it does indicate that they compete for the same people in the middle. I've been saying for a bloody long time now that the purely poll-driven strategic choice for Labour is to move right, for this reason. What they lose probably goes to the Greens, so the bloc gets stronger (and makes the Right weaker simultaneously), but I don't even think the movement is linear. Labour's support fluctuates far more in total than Green support so it's definitely not one-for-one. I think this was what they were doing under Shearer.
But this puts me in a personal quandary, because I don't want a right wing Labour party in power. So while I can see that it's to their advantage, it's not what I want for them. I think quite a lot of the Labour membership has felt this way too, which is where the whole conflict between rank and file and the leadership has come from. The leadership wants to win, and moving right is a winning strategy. But the rank and file want it to represent them. When they ended up winning, by rolling Shearer, they got more of the the Labour party that they want, but possibly not the Labour party that will win 2014. But it might be a stronger party altogether by 2017, able to capitalize on the slow decline in Key's popularity. This could be much better than having a narrow 2014 win with a significantly more right wing Labour, which has to fight for every tiny little change. That's a recipe for either a strong right wing move by them again, or a one-term government.
What is surprising is that there's even a chance of an upset this time around. National are doing exactly what Labour did when threatened by Brash. Play the man. It's actually a sign that they've lost control of the game. They may win, but it's down to the luck factor of how much they can damage Cunliffe's credibility. It's very dangerous political territory, because mudslinging can become tit-for-tat, and any mud that sticks to powerful reigning politicians is always more damaging.
-
On the question of "What will Winston do?", the data I think would be most relevant that could be collected is "What do NZF voters want him to do?". If a strong and clear majority want him to go with National, that makes it very much more likely. Because he'd lose a lot of support if he didn't do it.
Also, on the high level of probability that "Winston decides", it's always got to be pointed out that he can't get too ridiculous in his demands, because there's no constitutional barrier in NZ to a Labour/National alliance. This would pretty much sweep all the minor parties into complete irrelevance. So the whole "tail wags the dog" argument is bunk. If the actual political will in NZ was centrist between Labour and National, then they could rule outright with near certainty, nutting out some compromise position between them. It might even be less of a compromise than what Labour would have to cede to the Greens, or what National would have to cede to NZF.
I don't think it will happen, but only because Winston surely knows this. It's a threat that can always be used to bring his demands back to reality.
-
Sofie Bribiesca, in reply to
I would suggest there are a few in Parliament with strong egos and Winston will fall into that category. It must over time (of the constant belittling of him from KeyCo.) have a small effect as to which way you could turn. As Peters has worked with Labour before, and understood his position with the Clark Govt , I can see his Party finding mutual ground on the Labour side. At the same time as them having similar views there, the compromise would be to the Greens but with that he is the consummate politician, I'm sure the common ground with them on environment policy alone would enable them to work together. I thunk
-
BenWilson, in reply to
It must over time (of the constant belittling of him from KeyCo.) have a small effect as to which way you could turn.
I doubt he likes Key, but that would make it all the sweeter to have him on his knees, begging for forgiveness. He could also be in a position to pinch out the other parties completely. Why not, when one has the power? Why put up with ACT (who he openly despises), and MP (whose seats he has said shouldn't even exist). He could take pity on Dunne as he sees fit, but I'd think he'd find it more conducive just to shut the guy out.
-
Here is my nightmare scenario. Winston decides to go with National - on the condition of John Key’s scalp. Key retires to Hawaii a hero, the guy who took one for the team.
Winston can be a minister, in or out of cabinet, in any post that does not affect commerce or trade. He can push any social conservative agenda he wants (John is relaxed about the little things). NZ First will give National confidence and supply. But most importantly, it must not vote down any TPPA bill (it may abstain or whatever).
Oh and for falling on his sword, Key gets to pick his business friendly successor.
-
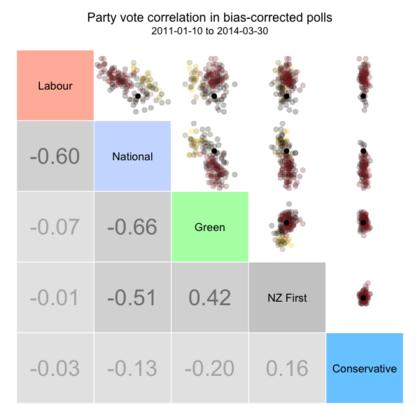
One thing I noticed - the scale on the scatter plots are not the same. The large movements across in the Conservatives column are actually pretty meaningless, as they're only fractions of a percent.
The updated one has constant scales (same patterns, just a bit easier to see the impact). Also, I've coloured the dots by when the poll occurred. Around election time they're transparent black, before then is yellow, and towards today is red.
-
Colin Craig needs every fraction of a percent he can get.
-
bmk, in reply to
On the question of "What will Winston do?", the data I think would be most relevant that could be collected is "What do NZF voters want him to do?". If a strong and clear majority want him to go with National, that makes it very much more likely. Because he'd lose a lot of support if he didn't do it.
In a normal world - yes. But with Winston I don't see it. Before the '96 election he railed strongly against National - he made it seem quite clear that a vote for NZF was a vote to boot National out. After the election everyone assumed he would go with Labour including all the media. People close to him said that he partly went with National because he was so annoyed with all the media assuming he would go with Labour (which was a perfectly valid assumption considering his preëlection statements). Another factor was apparently that National simply offered a lot more than Labour - I think this could happen again.
Anyway what I'm trying to say is I think Winston will do whatever he wants - he won't do what his supporters want(in fact he especially may not care about them since it's quite likely to be his last term) unless it coincides with his own interests.

Post your response…
This topic is closed.