Speaker: What we think and how we vote
45 Responses
First ←Older Page 1 2 Newer→ Last
-
BenWilson, in reply to
Perhaps normalizing the size of the groups? You'll have to drop off the smaller parties to do that. Then you can at least explore the associations. Pick a size for each of the top, say, 5 parties, and sample out 5 groups that large.
-
BenWilson, in reply to
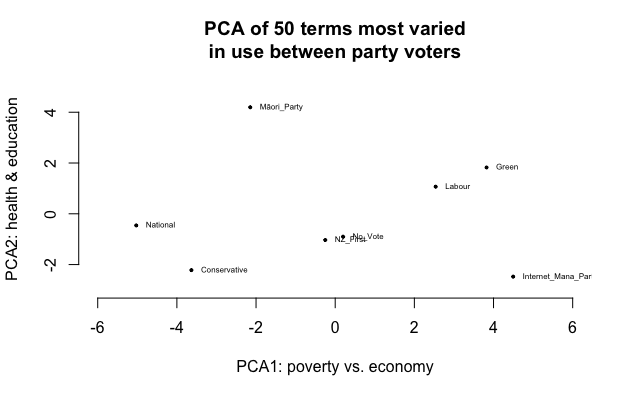
I think the left/right axis Ben found in the previous election results from the survey generally looks like it is mirrored in the economy/poverty axis (which are inverses of each other except in the middle).
So “economy” is associated with the “Right” of the PCA1 and “poverty” is associated with the “Left” of PCA1? Curious what’s the most extreme in each direction in PCA2. In other words, what terms are orthogonal to those two, when it comes to explaining the variance (not that you don’t understand that, I’m just saying what I’m interested in finding).
ETA: I think that what you have is an interesting finding because, AFAIK, that has changed since the prior election. The Left was not so aligned around poverty before.
-
BenWilson, in reply to
Not that there were specific poverty questions in what I looked at. And I guess the general cluster of Left questions was around income differences, housing, benefit cuts, unemployment. I guess what I find interesting is that in the words of the respondents this would be summed up as "poverty". Sometimes the hive mind really does nail it. Poverty is our big problem in NZ, if you are "of the Left". It sure feels that way to me.
-
Link to the PA discussion that went into detail on the NZES 2011. Just for comparison.
-
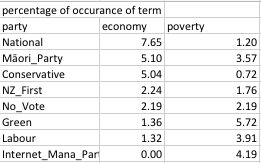
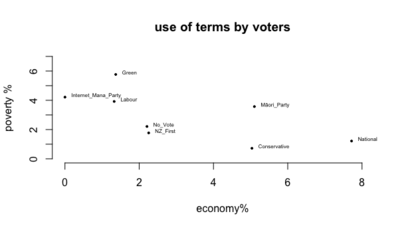
The correlation between use of economy and poverty by party voters is -0.64. Of course no one knows if that is “good” correlation for this kind of data or not, because this is kind of being made up as we go along.
I would say the two terms are not exactly polar opposites (and they needn’t be) but they do tend to sort out the groups if you use either term. A better model might be landmarks that people are placing themselves around than a sliding 2D scale.
Economy has the greatest variation in terms use between parties, poverty the second greatest, so they do seem to be distinctive.
-
On my todo eventually list is check previous ones to see if they had the free text option, and see what the terms analysis shows.
-

I reran the PCA excluding all but the 50 terms that showed the greatest variation between parties, PCA1 was indeed the Poverty-Economy continuum, PC2 seems education and health related, PCA3 (not shown) was environment and separates out the Greens and Labour, PCA4 was land sales/immigration (NZ First), PCA5 was morality (Conservatives).
-
Sacha, in reply to
Great work. The Maori Party's positioning is an interesting reminder why they are not likely to merge with Mana any time soon. Any way to make those party name labels bigger?
-
While the Māori Party and Mana seem far away in terms of their voters interests, I wouldn't necessarily say that stops a merger- If it worked it would just pull the points together. At the moment National seems to contain people who voted for economic growth and people voting for stability, and those interests aren't always going to align.
Absolutely I could make the labels bigger, but then I will also need to spend the time positioning them to fit- for the above graphs I was just dropping them in be the dots.
-
BenWilson, in reply to
Is PC2 health vs education? Or are they linked and opposed to less something less easy to summarize? Are you able to show the top 10 word loadings on the graph? Presumably the party positions are centroids?
-
Also interested to know how much variation each axis explains. Does it diminish rapidly so that PC3 is approaching the limit of usefulness?
-
Health and education linked, against a bundle of things with no clear theme. Let's call it issues vs people for the moment.
I'm away from my analysis code until the end of the week, so numeric specifics are going to have to wait.
-
I know exactly who I'm voting for: anyone who believes that ladders of opportunity are a public good rather than an accident of privilege.
-
Ian Dalziel, in reply to
step right up
ladders of opportunity are a public good
'Too rights' make a rung!
-
Great work David. Thanks.
-
David, I don't suppose you'd have the NZES stats for % swing (ie vote movement/flows) between the various political parties 2011-2014 would you ?
-
David Hood, in reply to
Mr Mark, here are the raw numbers of
(who they say they voted for in 2011), (who they voted for in 2014), raw number
so that people can use the raw number to calculate either the percentage of the 2011 figure or the percentage of the 2014 figure.I will also note that I have not checked the 2014 figures for this yet but in the 2011 figures there was around a 5% (from memory) disagreement of people with their 2008 selves about who they voted for- a small set of people in 2011 put a different answer to who they voted for in 2008 than they put in 2008. So there is some naturally occurring error in these numbers.
vote2011,vote2014,count
ACT,ACT,6
ACT,Conservative,4
ACT,National,6
ACT,No_Vote,2
ALCP,Another_party,1
ALCP,Internet_Mana_Party,1
ALCP,National,1
ALCP,No_Vote,1
ALCP,NZ_First,1
Another_party,ALCP,1
Another_party,Another_party,2
Another_party,Conservative,1
Another_party,No_Vote,1
Conservative,Another_party,1
Conservative,Conservative,19
Conservative,Green,1
Conservative,Internet_Mana_Party,1
Conservative,National,2
Conservative,No_Vote,3
Conservative,NZ_First,5
Democrats_for_Social_Credit,NZ_First,1
Do_not_know,ACT,1
Do_not_know,Another_party,2
Do_not_know,Conservative,6
Do_not_know,Green,20
Do_not_know,Internet_Mana_Party,3
Do_not_know,Labour,31
Do_not_know,Māori_Party,10
Do_not_know,National,33
Do_not_know,No_Vote,23
Do_not_know,NZ_First,15
Green,Conservative,5
Green,Green,144
Green,Internet_Mana_Party,3
Green,Labour,27
Green,Māori_Party,2
Green,National,13
Green,No_Vote,10
Green,NZ_First,13
Green,United_Future,2
Labour,Another_party,1
Labour,Ban_1080,1
Labour,Conservative,7
Labour,Green,77
Labour,Internet_Mana_Party,10
Labour,Labour,431
Labour,Māori_Party,15
Labour,National,57
Labour,No_Vote,41
Labour,NZ_First,53
Mana Party,Another_party,1
Mana Party,Green,5
Mana Party,Internet_Mana_Party,11
Mana Party,Labour,4
Mana Party,Māori_Party,4
Mana Party,No_Vote,3
Mana Party,United_Future,1
Māori_Party,Green,13
Māori_Party,Internet_Mana_Party,6
Māori_Party,Labour,15
Māori_Party,Māori_Party,42
Māori_Party,National,6
Māori_Party,No_Vote,11
Māori_Party,NZ_First,8
National,ALCP,1
National,Another_party,1
National,Conservative,28
National,Green,27
National,Internet_Mana_Party,1
National,Labour,35
National,Māori_Party,5
National,National,946
National,No_Vote,65
National,NZ_First,33
National,United_Future,3
No_Vote_or_Too_Young,ACT,2
No_Vote_or_Too_Young,Another_party,1
No_Vote_or_Too_Young,Conservative,4
No_Vote_or_Too_Young,Democrats_for_Social_Credit,2
No_Vote_or_Too_Young,Green,30
No_Vote_or_Too_Young,Internet_Mana_Party,3
No_Vote_or_Too_Young,Labour,36
No_Vote_or_Too_Young,Māori_Party,1
No_Vote_or_Too_Young,National,54
No_Vote_or_Too_Young,No_Vote,36
No_Vote_or_Too_Young,NZ_First,13
NZ_First,Ban_1080,1
NZ_First,Conservative,5
NZ_First,Green,5
NZ_First,Internet_Mana_Party,4
NZ_First,Labour,19
NZ_First,National,9
NZ_First,No_Vote,13
NZ_First,NZ_First,81
United_Future,Conservative,3
United_Future,Labour,2
United_Future,National,3
United_Future,No_Vote,1
United_Future,United_Future,1 -
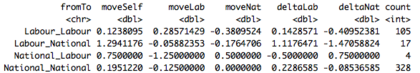
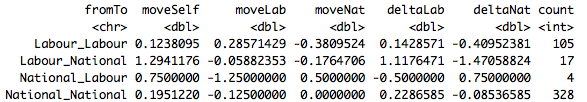
With my fundamental opinion that the left/right median voter theorem is rubbish when applied to multiple interests MMP New Zealand, I feel thoroughly vindicated by looking at the direct movements between National and Labour.
The people that moved from Labour to National between 2011 and 2014 did not think the parties had significantly shifted position, but thought that they themselves had changed.
The people that moved from National to Labour thought that they themselves had moved to the right and Labour had moved to the left, putting them further from Labour in 2014 than when they voted for National in 2011. -
Brilliant. Thanks, David. Your data even allows me to calculate movement in and out of non-voting - all I could ask for and more.
On the the left/right median voter theorem being tosh - completely agree. Similar findings in recent analyses of British voters. A significant body of voters do not vote for the Party closest to them on the Left-Right spectrum. Voter behaviour is much more fluid and much more complex than that. Partly why I see Rob Salmond's emphasis on "Centrist" voters as far too simplistic.
-
Just harkening back to the very first comment (about tirades). For the most important issues question, most of the entries were in uppercase. While I assume this is just a transcription thing- like who transited it, you can rank the parties by how many of the voters issues were written in ALL CAPS
Party percent_shouting
Internet_Mana_Party 88
Green 89
Labour 92
NZ_First 92
Māori_Party 93
Conservative 94
National 94Which I am sure has no analytical merit what so ever, but it is entertaining that it matches the way the parties are order in Left to Right (or Poverty vs Economy)


Post your response…
This topic is closed.