Speaker: House prices and the "Magic Money"
162 Responses
First ←Older Page 1 2 3 4 5 … 7 Newer→ Last
-
Katharine Moody, in reply to
I was think of the LGA (local government act) 2002., which free market types blame for red tape making house prices rise
The influence of LGA 2002 on house price rises relates to the provisions in that Act for Development Contributions as a means for local authorities to fund the cost of the growth component of infrastructure supply that comes with new development.
Each local authority sets the level of them themselves (Kapiti, for example, didn't actually introduce them until 2005/06).
-
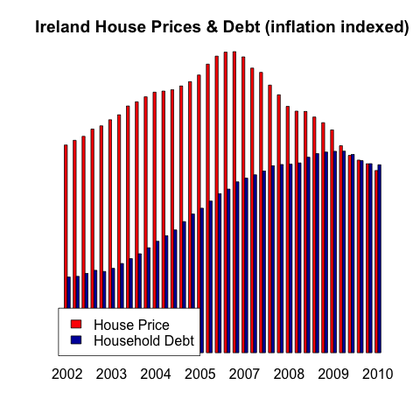
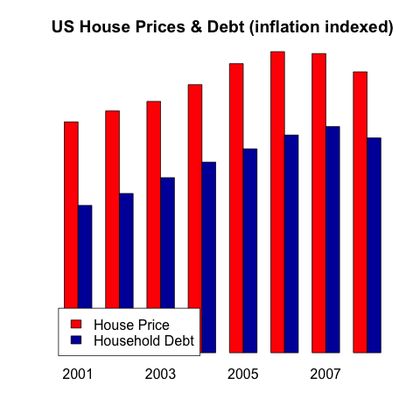

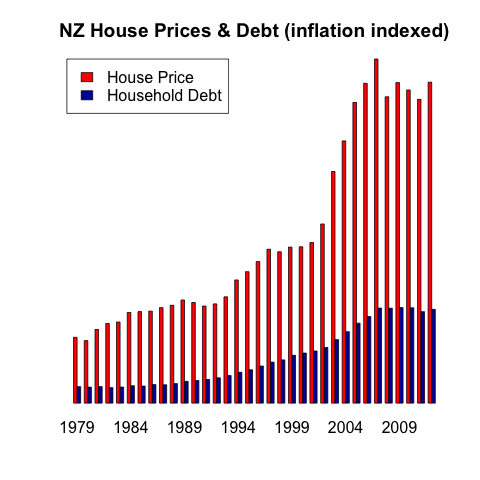
Here are a few other graphs, that didn’t really fit the post focusing on working out the values for New Zealand. Looking at debt in Ireland (internal boom and bust) and the United States (the size of the market means that nationally it is mostly internal buying) you can see the way debt tracked up not only in the same pattern but also by the same amount. The NZ market is different, which suggest applying supply and demand models to it based on a general understanding of housing supply and demand will be wrong.
-
Rich of Observationz, in reply to
And that one house is now worth 256 billion dollars
But the figure you have for "total house value" is a statistical valuation, right? It's based on looking at actual sales prices versus a baseline (like GV) and applying that to all the properties. So (at an extreme example) if there was one house sale and it sold for twice GV, all the houses in the country would be valued at twice GV.
Also, is commercial debt (as in property developers borrowing to "land bank") counted as household debt?
-
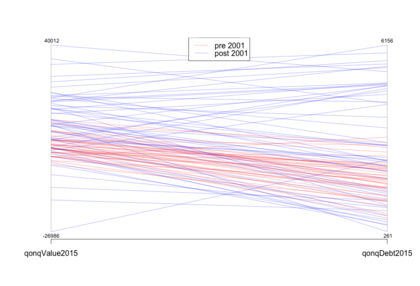
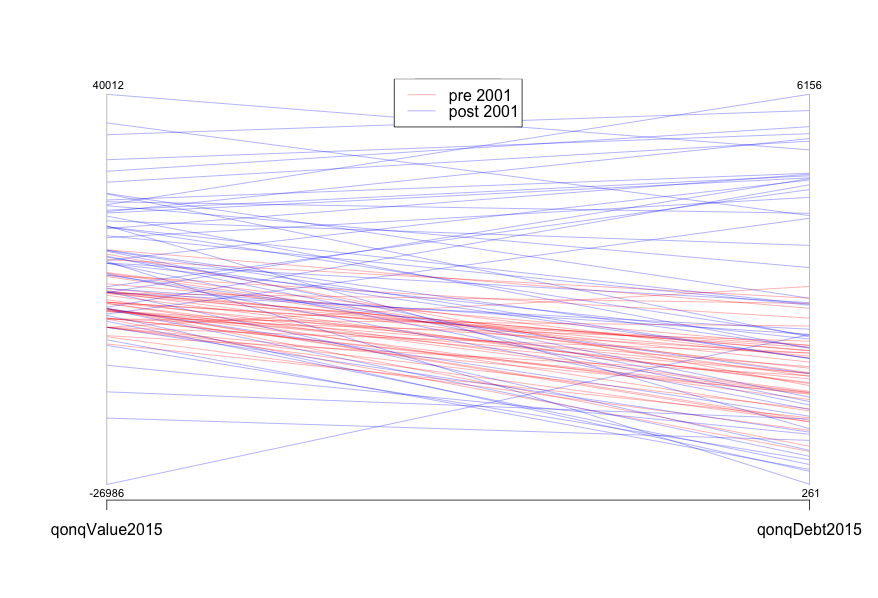
One more graph- I was introduced to parallel coordinate charts this week, for showing the relationship between two variables. this is NZ Quarter on Quarter debt and housing prices. I didn't use it because most people have never seen it before so it can be a bit baffling. But the largely predictable parallel lines for the pre2001 data suggest that there is a tight relationship, the all over the place slopes of the post 2001 data suggests that relationship has weakened dramatically
-
The housing value figure is based on QV though, it’s not the value of houses sold.
$300billion injected into the economy would cause massive effects, a good year from Fonterra injects $1b and the effects are felt.
-
Snap with Rich of Observationz
-
Thanks David for taking the time to put this together. I have always expected that FDI in our housing market was a problem, but never expected that if and when quantified it would be;
300 billion of the 800 billion in the past decade
That is just mind-blowing. So much so that I really do wonder whether an analysis which separates out what portion of that 300 billion could likely be due to a one immigrant household purchasing one residence using overseas sourced capital. Whatever then is left over of that 300 billion, would perhaps more accurately reflect the FDI (i.e., FDI not for the purposes of owner-occupier) in our housing market.
-
David Hood, in reply to
But the figure you have for “total house value” is a statistical valuation, right? It’s based on looking at actual sales prices versus a baseline (like GV) and applying that to all the properties.
It is, ...but if you look at the REINZ property sales graph is has the same pattern of rises and falls as the house values one, so without access to the REINZ sales data the similarity of the REINZ graph to the total value graph means that the lack of relationship between values and debt should be reflected in prices. That is an deductive leap in the absence of the actual data, but one I can't see any evidence for not making. I will also point to other countries and say "their numbers add up".
Also, is commercial debt (as in property developers borrowing to “land bank”) counted as household debt?
I don't know (if anyone does have public data getting total bank lending by category that would be handy) but given the "Magic Money" gap has grown to 60% of the "traditional household purchases through mortgages" influence on the entire national housing market in 15 years, I would expect there to secondary evidence inside the NZ economy figures.
-
David Hood, in reply to
$300billion
In reality the 300 billion is just an influence figure (not actual cash) and the meta point would be that there is a 3 to 5 influence that needs to be accounted for in any discussion. That is also a 3 to 5 influence across all properties in New Zealand.
-
David Hood, in reply to
The influence of LGA 2002 on house price rises
IMO the whole LGA arguments people make involve a bit of cognitive dissonance- Not only did prices go up, the amount of debt required to purchase the increased prices went down as a percentage of the price, which is really, really weird if the LGA was the reason.
-
…but if you look at the REINZ property sales graph is has the same pattern of rises and falls as the house values one, so without access to the REINZ sales data the similarity of the REINZ graph to the total value graph means that the lack of relationship between values and debt should be reflected in prices.
The REINZ sales graph and the QV values will always correlate because recent sales are used as input to calculate the QV's.
You're not comparing apples with apples, you need the $ figures for houses actually sold to compare with the $debt, not the QV valuations.
-
Katharine Moody, in reply to
IMO the whole LGA arguments people make involve a bit of cognitive dissonance
I agree - same as the RMA arguments.
-
You're comparing the theoretical increase in the total value of the book (all houses in NZ) with the increase in debt used to pay for sale of part of the book (houses actually sold)
-
Katharine Moody, in reply to
The REINZ sales graph and the QV values will always correlate because recent sales are used as input to calculate the QV’s.
They are but perhaps it also needs mentioning that a great deal of added internal borrowings are likely based on leveraging the capital arising from QV revaluations without any corresponding house sale.
-
David Hood, in reply to
You’re not comparing apples with apples, you need the $ figures for houses actually sold to compare with the $debt, not the QV valuations.
I don't think you do. The quantum may be different, but the pattern is the same. So for example Figure 2 would show the same lack of relationship for the more recent period. Debt would still explain the same proportion of the pattern, and the relative importance of the unknown component is just as strong on sales.
Other explanations are that NZ calculates total housing value in a completely different radical way to the rest of the world (in which case the NZ economy is toast as our major national asset is worth about 60% of what we have been claiming it is). Or that in the United States and Ireland, in every year everyone in the country has been selling their house to everyone else in the country, so that their total value of houses figures are based completely on prices.
-
David Hood, in reply to
They are but perhaps it also needs mentioning that a great deal of added internal borrowings are likely based on leveraging the capital arising from QV revaluations without any corresponding house sale.
Yep, but if that borrowing was being used to buy houses, both housing value and borrowing should be moving up.
-
Whatever the explanation is, it will also have to shine light on the divergence between change in value vs change in debt (Fig 2) in the period starting circa 2002 when the value line started racing above the debt line. Also in 2008 when the value line plunged below the debt line.
Picking those two years suggests that some relationship with the state of the international financial markets might exist (2002 being the start of a massive bull market, 2008 when the GFC was hitting in full force).
Would any clues be gained from examining NZ's capital account figures.
-
linger, in reply to
our major national asset is worth about 60% of what we have been claiming it is
Can we use an overall figure this way? If the “magic money” is from foreign investors/ speculators, it will likely be directed towards properties with the highest perceived (short-term) rise in value, mostly in big cities, and not in places like (for example) Eketahuna or Timaru. So, some sectors of the market may be valued more or less correctly, and others wildly inflated.
(Reading back: this may be a restatement of Rich's point above. I'm not sure.)
-
David Hood, in reply to
Would any clues be gained from examining NZ’s capital account figures.
I last looked at it a couple of years ago, but what I found in that area then is that the inflow and outflow of capital from NZ used to be a really bad predictor of house value, but it has been improving. I haven't gone back to check what has happened lately, though.
-
David Hood, in reply to
So, some sectors of the market may be valued more or less correctly, and others wildly inflated.
Undoubtably, but without access to the information on where properties are selling, and for how much within each area, and both of those over time, I can think of no way to break it down regionally. So all we can really say is that there is an influence that wasn't showing up before, and at a national level the influence is about 60% of the influence of people who need loans (3/5ths).
-
Sacha, in reply to
Kia ora. Thank you for popping by.
-
Kumara Republic, in reply to
Authority X said it was supply constriction due to RMA restriction. I am sure they did.
It's surprising how often this is offered as a received truth.
I've been having fun & games with yet another ACToid on Twitter about the inconsistency of said argument.
-
chris, in reply to
Undoubtably, but without access to the information on where properties are selling, and for how much within each area, and both of those over time, I can think of no way to break it down regionally.
Some regional breakdowns for you (5 years).
-
Russell Brown, in reply to
Kia ora. Thank you for popping by.
Indeed. And thanks also to David for participating so usefully in the discussion of his post. Y'all are good.
-
The change in the scale of movements on Fig. 2 coincides with the adoption in 2004 of a new methodology for calculating the HPI.


Post your response…
This topic is closed.