One of the prevailing criticisms of the Government's Capping regime is that it forces departments to lay off staff, only to rehire them as consultants (and after paying out their redundency).
But is it true?
The most comprehensive source of information we have on the state sector comes from the State Services Commission's Human Resource Capability survey. It's a wealth of information – except it doesn't cover casual contractors or consultants.
A Cabinet paper in April 2010 offered a tantilising glimpse. Somewhere in the bowels of Treasury, somebody managed to compile this:
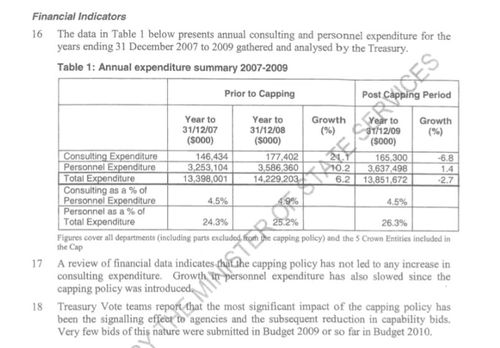
It showed that, one year after the cap was put in place, personnel expenditure slowed and “the capping policy [did] not led to any increase in consultant expenditure”.
That was the only time this data has appeared. Subsequent Cabinet papers never used this data again. So I OIAed it and made a spreadsheet.
This here is the money shot (or lack thereof). Changes to staff numbers (EFTS from the HRC) are plotted horizontally and changes to consulting expenditure are plotted vertically. If departments are replacing staff with contractors, then the results should clustered around the top left quadrant. They are not.
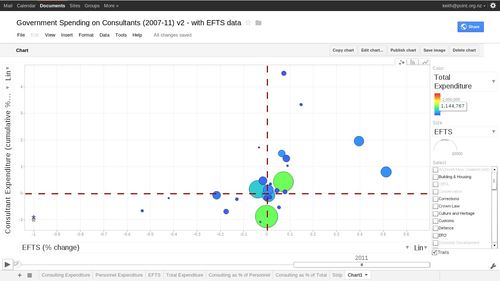
(You can explore the data yourself here. The second-to-last sheet has the Motion Chart shown above. I can't be bothered figuring out how to make the embeded links work in this CMS.)
Based on this data, there is no obvious replacement going on. Except there are gaps in the data, missing departments like Education, MED, DoC, TPK and NZTA. A few months back, Max Rashbrooke OIAed individual departments to try to get the same numbers and arrived at a sum of $375m a year spent on consultants (compared with $189m in these Treasury numbers).
The missing departments probably account for most of this gap, and there's probably some definitional issues... hey, wait a goddamn minute! That's massive! These are not obscure, tiny departments: They make up 30% of “Core Government Adminisration” expenditure.
So, let me get this straight.
Back in 2010, looking at consultant expenditure was considered important to measuring the success of the Capping regime. Despite not having 30% of the data, they considered it proof that the Capping regime wasn't affecting consulting expenditure. Having declared that it was okay for that one year, they stopped measuring the the regime against this data, even though it was still being compiled by Treasury.
Unless someone's hiding some data from my OIA, I think it's fair to say that the government (this Government and the ones before it) actually has no idea how much money is being spent on consultants. If it did, why would Cabinet be justifying their decisions with such shitty data?
I don't really understand how it can be this hard to collect this information, or how it can *not* be a priority to collect this information, especially for a Government that's trying to rein in public spending.
Disclaimer: Some of my best friends are consultants. Actually, I guess I'm a consultant as well. Oops.
–
Dear Journalists,
Feel free to use this spreadsheet. A few things that you might find interesting:
- MAF spending on consultants tripled from $4.2m in 2008 to $12.6m in 2011. *coughmergercough* *coughchangemangementconsultantsspewcough*
- Housing NZ consultants expenditure doubled from $10.8m in 2008 to $20.6 in 2011.
- Biggest spender on consultants in the last 3 years was Environment, totalling $58.7m.
Scans of the OIAed documents are here: Page 1, Page 2, Page 3.